HAVE A NICE DAY
EDITORIAL OUTCOME THROUGH CODING
API DATA WEATHER VISUALIZATION PROCESSED THROUGH BASIL.JS
BASIL.JS
HGK
FACHHOCHSCHULE NORDWESTSCHWEIZ
DIGITAL COMMUNICATION ENVIRONMENTS
2021
PARTNER:
JO BANDIERA
EXHIBITION:
I NEVER READ


A collection of experimental visualizations on the weather in Basel, compiled into a booklet that blends code, storytelling, and data analysis.
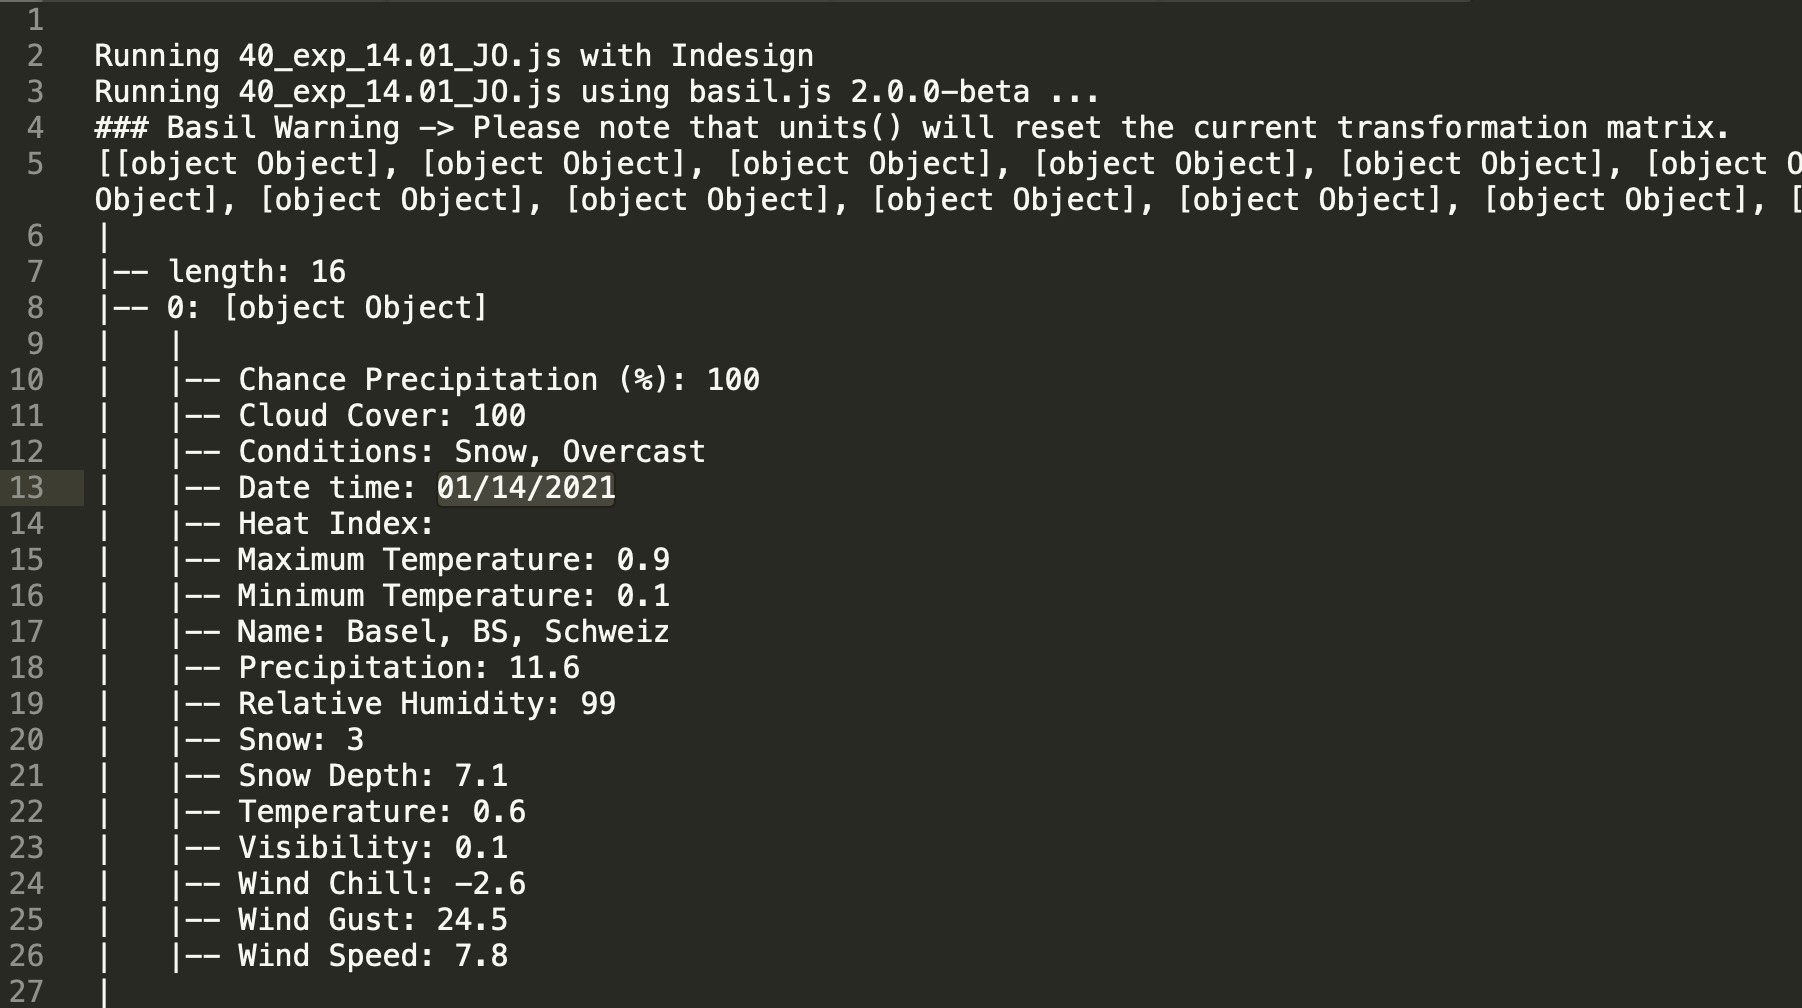
The process consisted in grasping API data from SRF Weather database, collecting for 15 different GPS location in the center of Basel the following data:
- Date, time
- Chance precipitation
- Cloud coverage
- Conditions
- Heat Index
- Maximum Temperature
- Minumim Temperature
- Precipitation
- Relative Humidity
- Snow
- Snow Depth
- Temperature
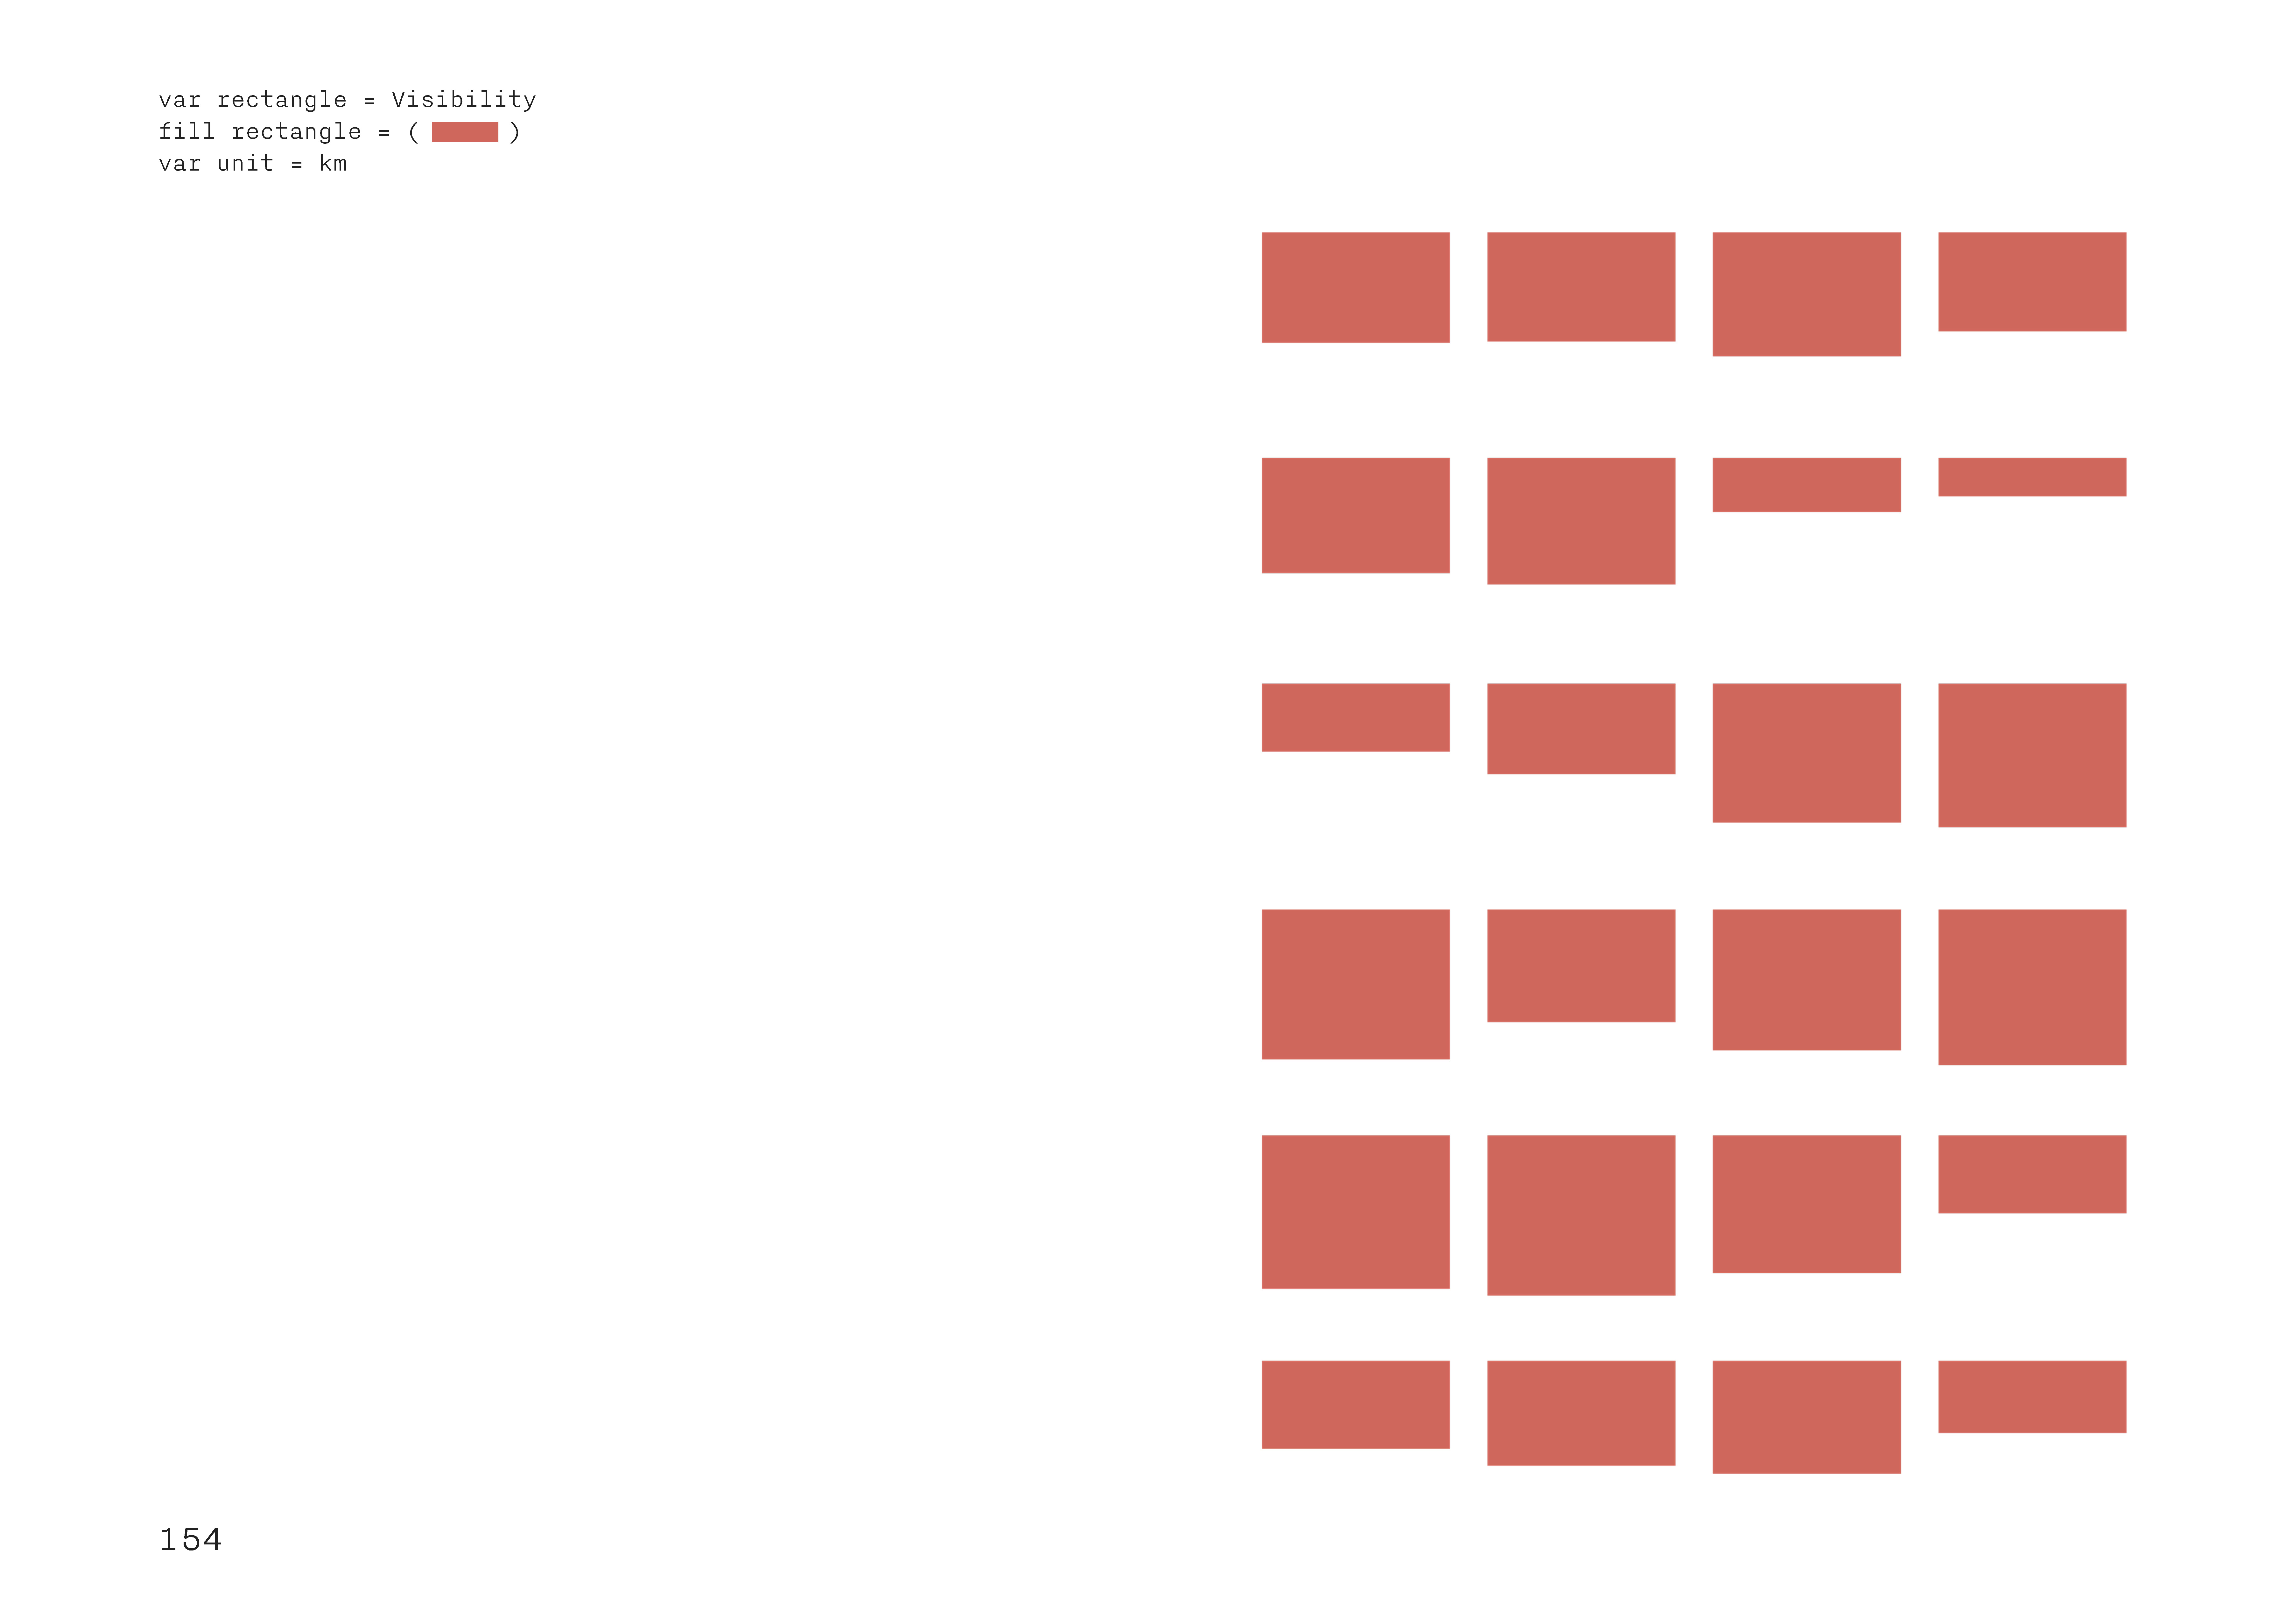
- Visibility
- Wind Chill
- Wind Gust
- Wind Speed
Within each of the three chapter we experimented with different visual languages, using different databases and data scales.
Each section stretch through different time ranges (hours, weeks, year) and space scales (the whole city or specific locations) exploring a variety of reading experiences, in which the data are dilated through pages or hyper-concentrated.
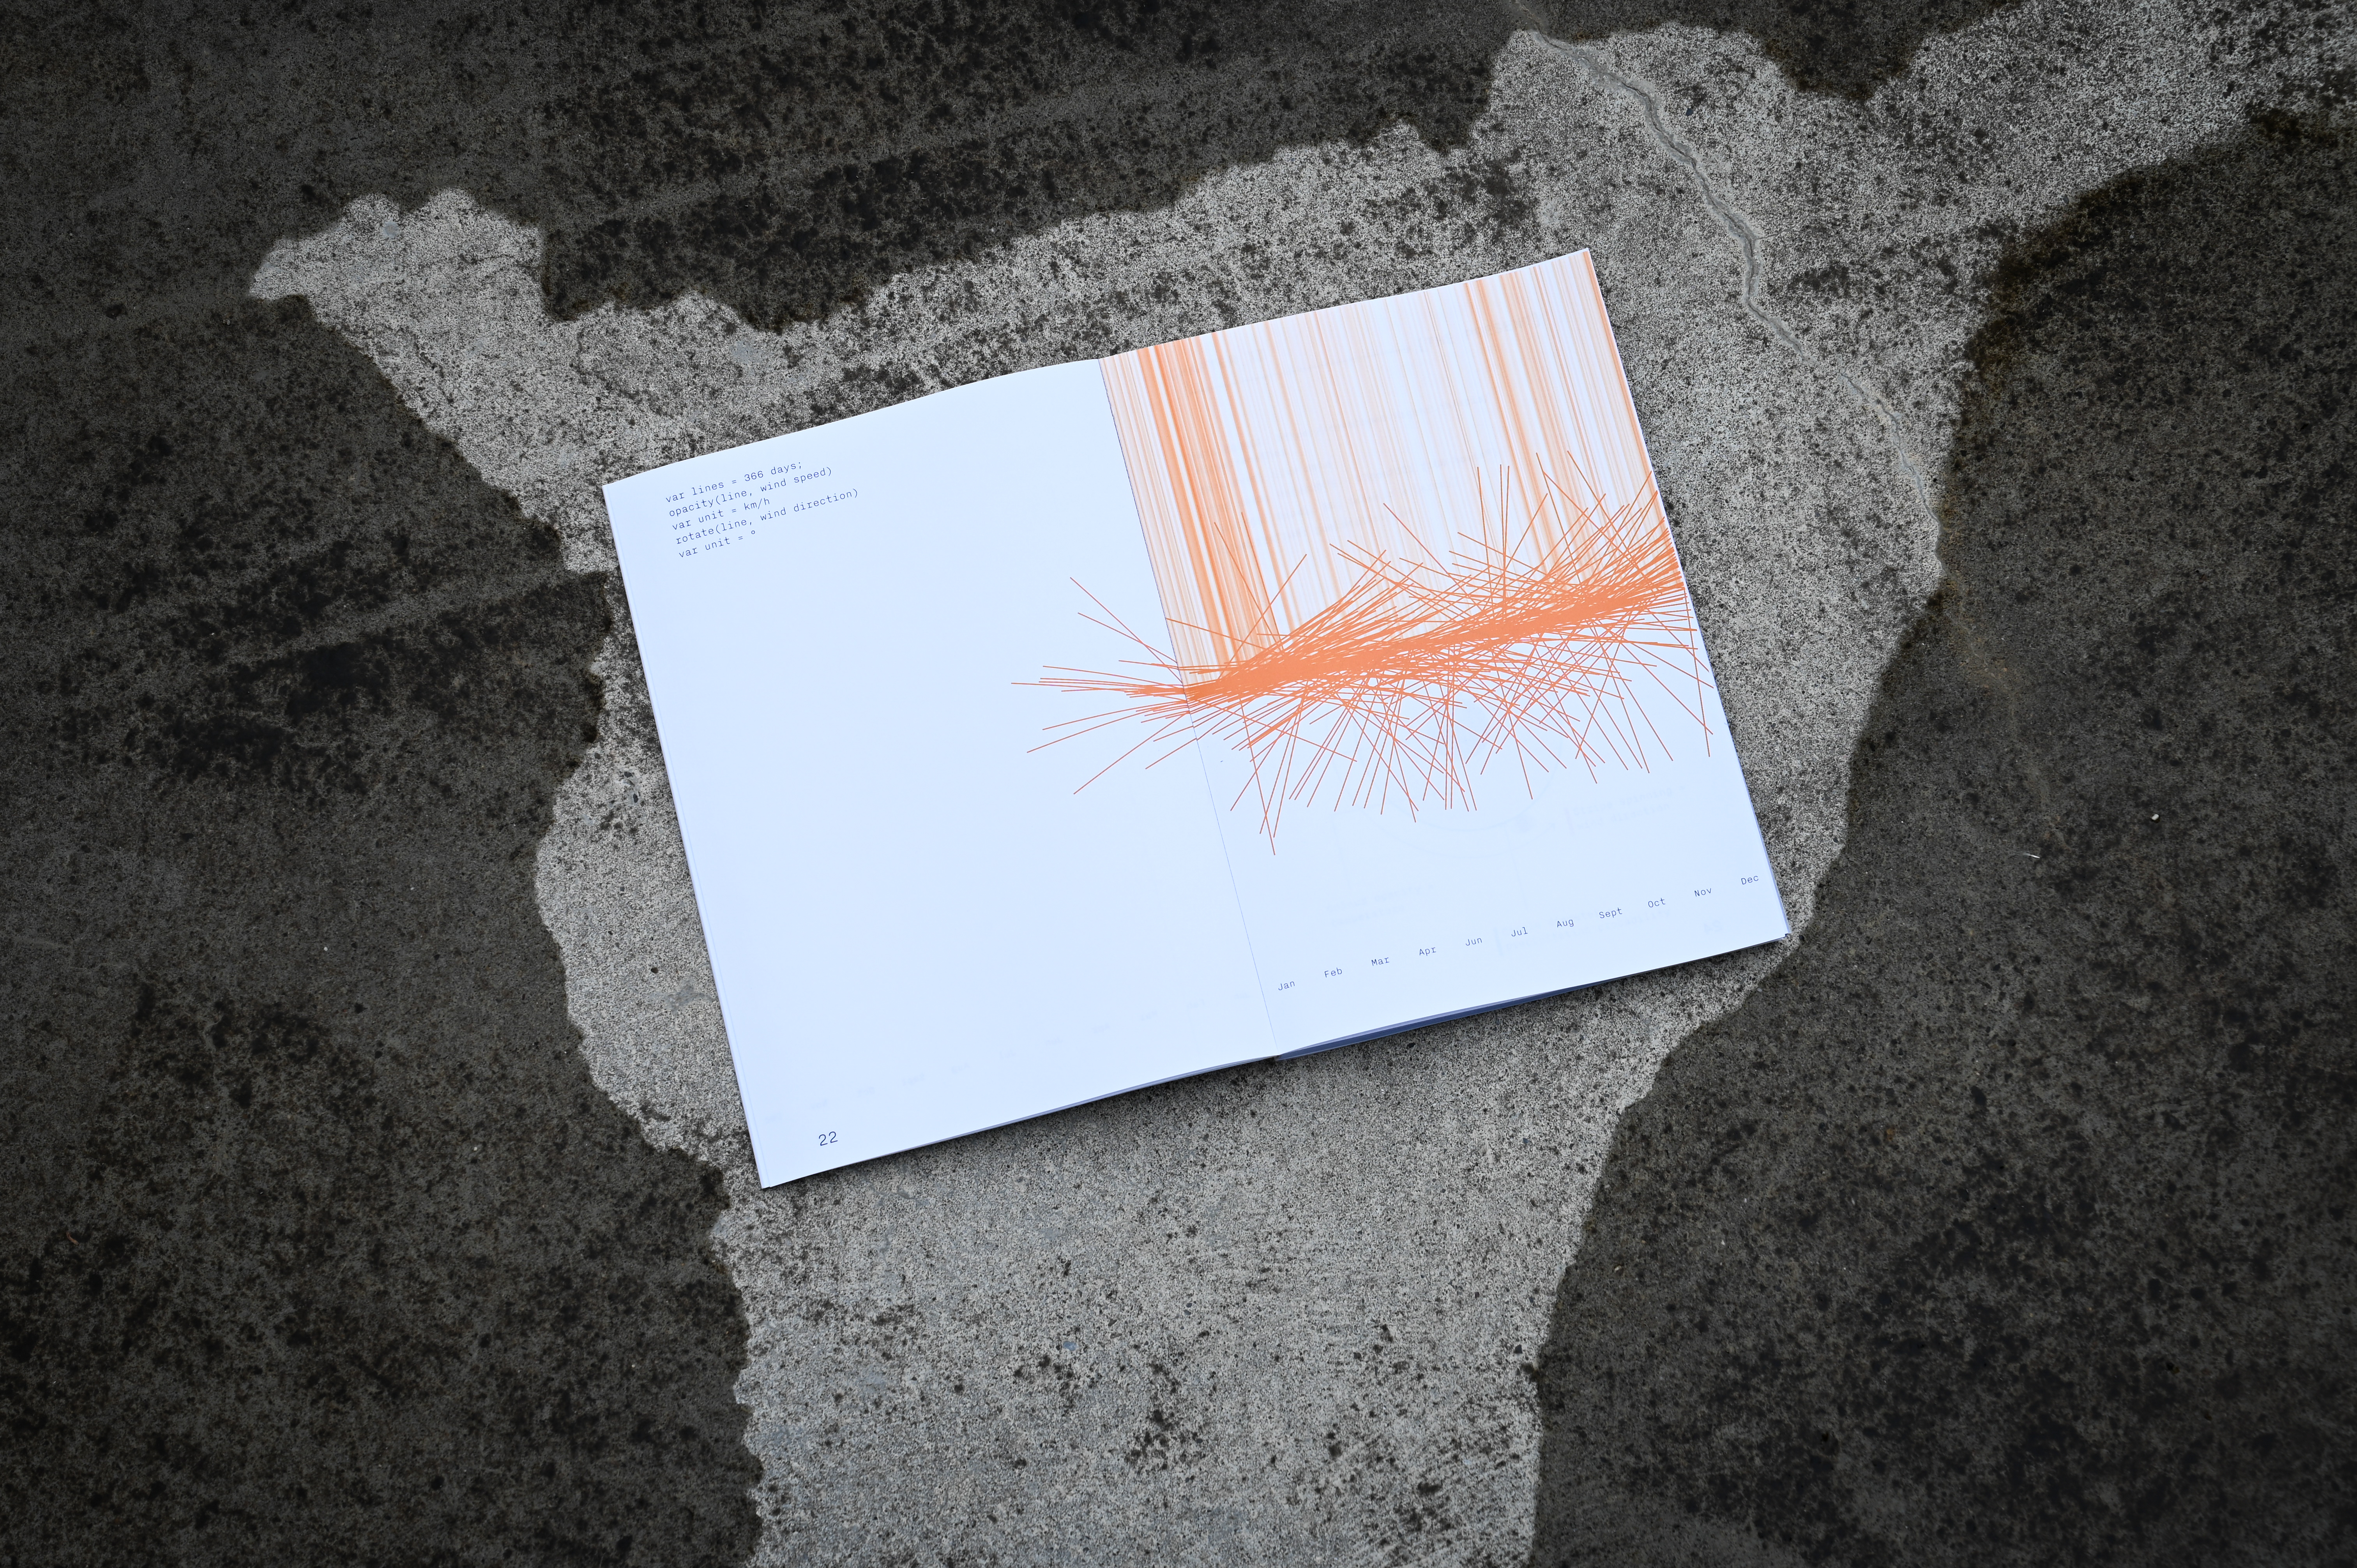
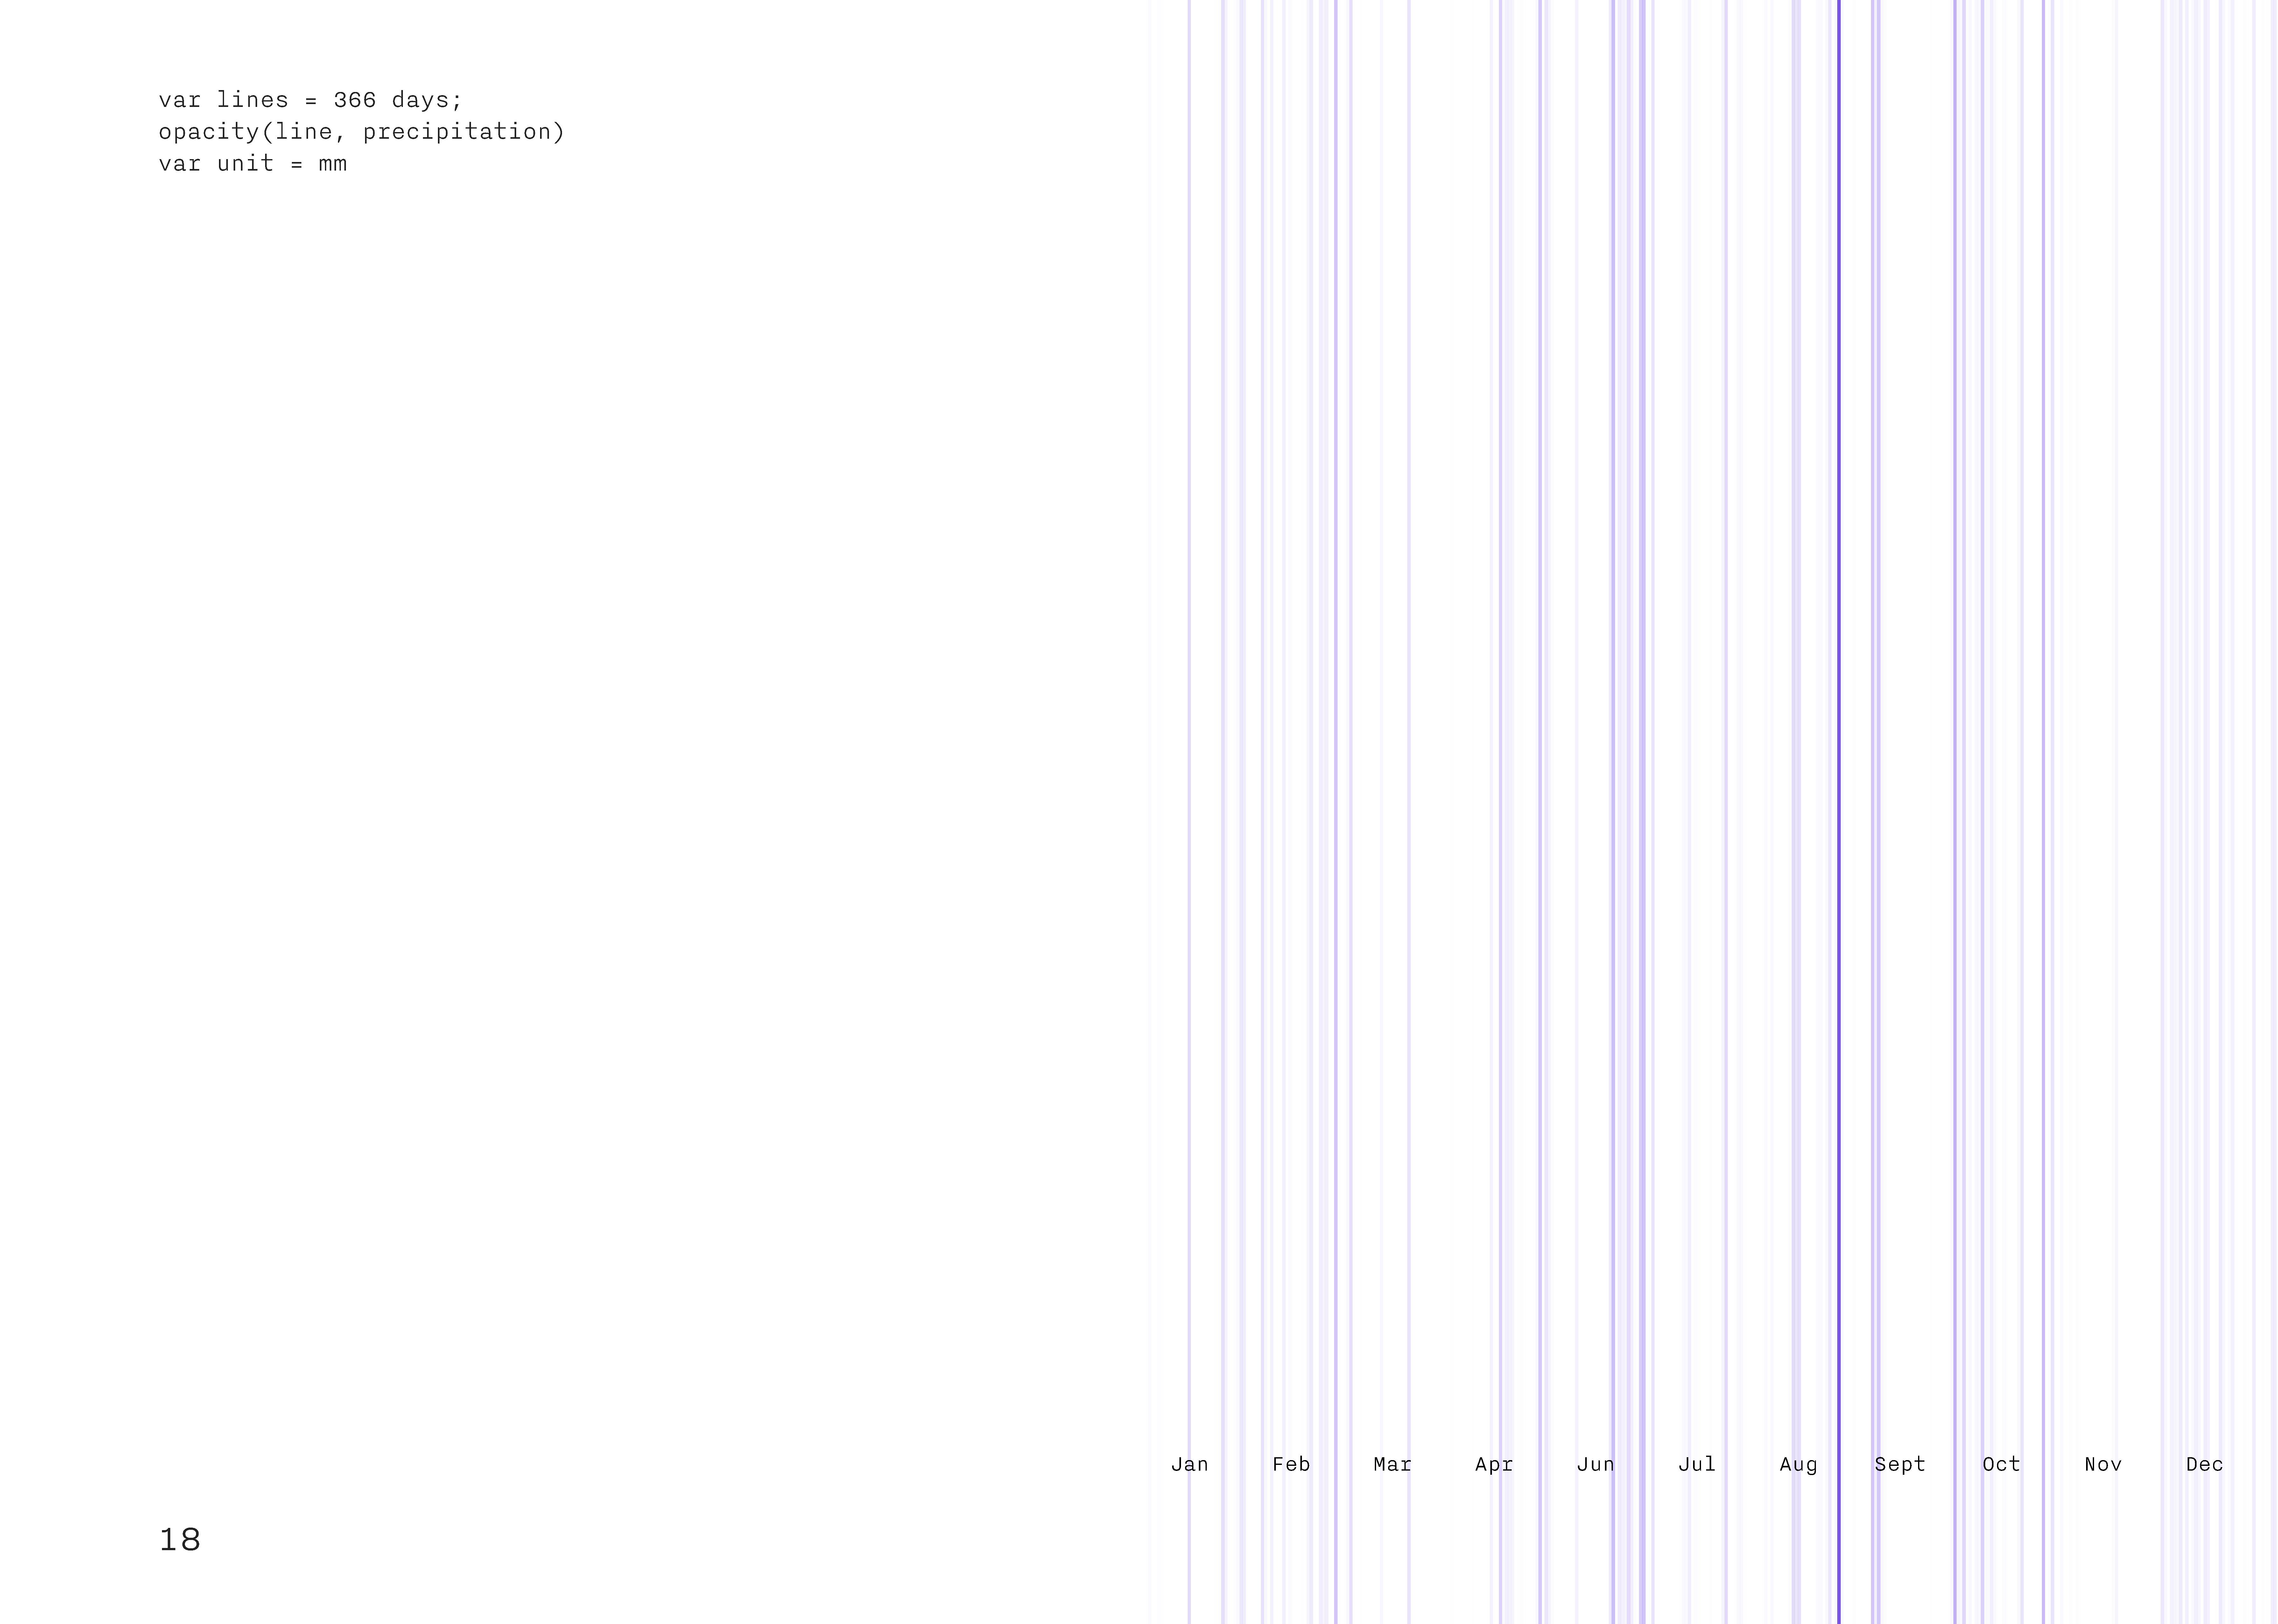
Chapter I - The Past
A visual summary of the weather across the year 2020
Data Source: Meteo Blue
Visualized Data:
- Temperature
- Sunshine duration
- Cloud coverage
- Humidity
- Precipitation
- Snowfall
- Wind speed
- Wind direction


Chapter II - The present
A real-time extraction and geo-localization of Data to build a map of Basel (15 GPS locations) and visualize different data at the same time.
Data source: SRF Weather database
Visualized Data:
- Date, time
- Chance precipitation
- Cloud coverage
- Conditions
- Heat Index
- Maximum Temperature
- Minumim Temperature
- Precipitation
- Relative Humidity
- Snow
- Snow Depth
- Temperature
- Visibility
- Wind Chill
- Wind Gust
- Wind Speed
Chapter III - The future
Calendar-based Forecast visualization
Data source: Visual Crossing
Visualized Data:
-
Minimum temperature
-
Maximum temperature
-
Cloud coverage
-
Precipitation
-
Snow
-
Wind speed
-
Visibility
- Conditions